


Hayley Gillespie at Art.Science.Gallery in Austin noticed that some of my prints submitted for previous shows would also fit for their latest: X Marks the Spot. She describes the show thus:
Quantitative or categorical, discrete or continuous, dependent or independent, variables allow scientists to measure and describe properties of the world around us. They are common to every scientific discipline and assume a wide range of possible values. With gravity and humor, precision and abstraction, record-keeping and experimentation, variables are made visible through the works of eight contemporary artists.
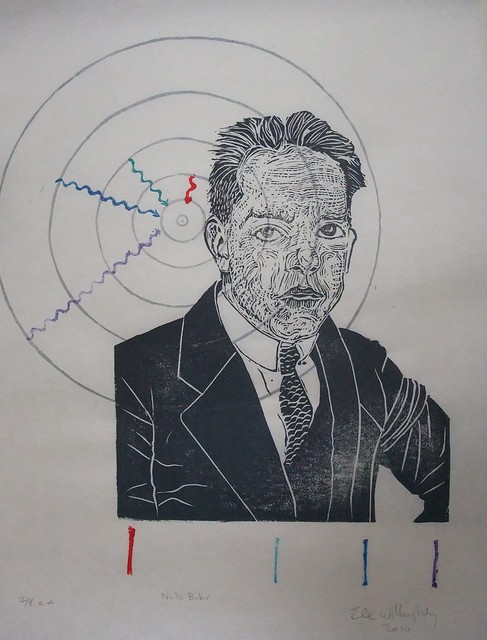
So, from October 25 to November 23, 2014, you can find my portraits of Niels Bohr, Caroline Herschel and Florence Nightingale, on exhibit. The show features eight artists, many of whom are 'data artists' and the images online look fascinating.
 It's particularly interesting to me, since I haven't really thought of my work as illustrating data or variables, per se, so much as illustrating the scientists themselves, since their work is integral to a full portrait. I believe mine are the only portraits and other works are more abstract, less figurative.
Each of these portraits does actually, now that I think about it, contain some precise representations of variable data. Niels Bohr's portrait contains the Balmer series of spectral lines given off by excited hydrogen gas. Caroline Herschel's portrait contains her own diagrams of the night sky and her observation of one of the several comets she discovered (hence, a mapping of position over time). Florence Nightingale's portrait shows her own statistical investigation of the causes of mortality amongst British troops during the Crimean War, shown plotted as a polar area diagram – her own statistical and data visualization innovation, sometimes called a Nightingale Rose Diagram.
 The other artists involved in the show have taken data -both their own personal life data, they have gathered themselves and freely available datasets and created artworks where they have developped their own methodologies for representing the data. They are working with everything from an artist's own personal experience of cancer care, the weather (where storms themselves are involved in the mark making), using algorithms to turn winds into drawing, to the instances where H.G. Wells specifies colour in his novels!
 One of the artists involved had been turning her own data into art - things like walks she takes, daily activities and nightly EEG sleep data - and then recognized that she is doing something algorithmically which could be translated into a phone app which would allow anyone to make art from their own daily lives. If you're in Austin, check out the artist's talk by Laurie Frick on November 8. She'll explain her process and her smartphone app FRICKBits, and how you can use it to make art of your daily life too. How cool is that?! The app is for iPhone, and I have an Android, so I might have to ask RJH if I can play with his phone.
In other news, if you happen to be in Europe and read German, check out the Christmas/New Year issue of Happinez magazine, which will be featuring my Chinese Zodiac series!
No comments:
Post a Comment