Showing posts with label maps. Show all posts

Saturday, May 16, 2015

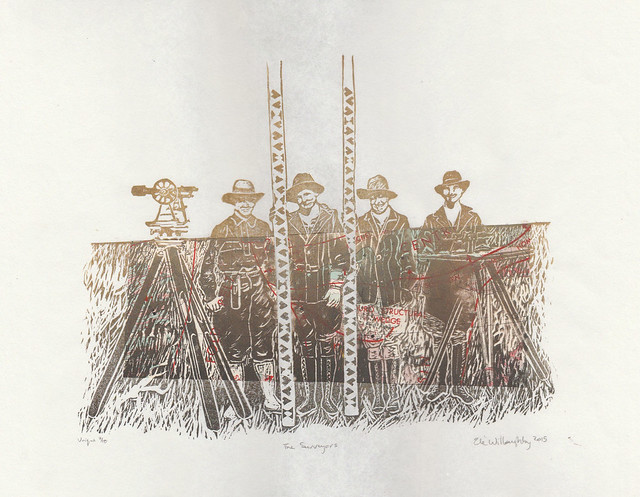
Surveyors, an all-female crew in the American west in 1918

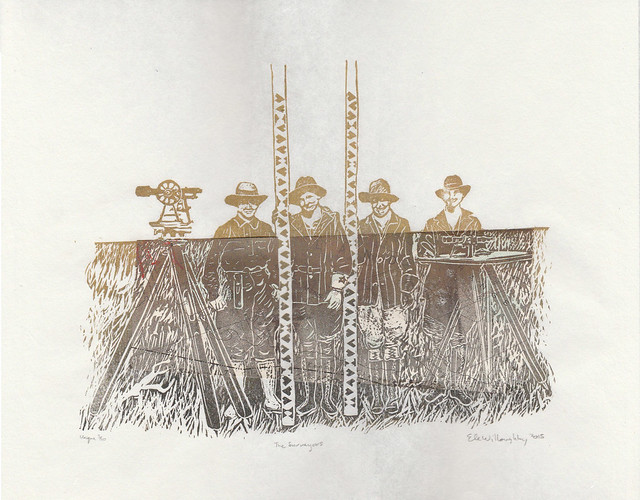
Surveyors1
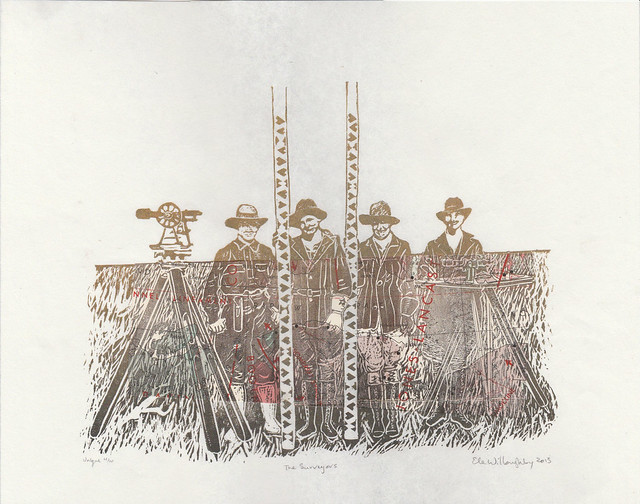
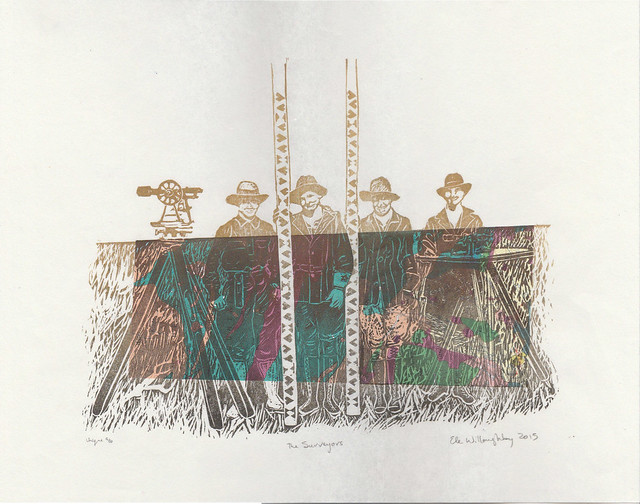
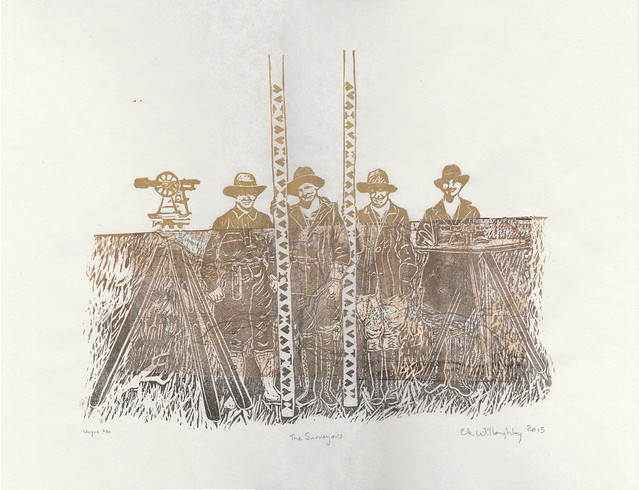
The Surveyors, linocut with vintage topographical map, 14" x 11", edition of 10 each unique, 2015 by Ele Willoughby

All female survey crew working on the Minidoka Project, Idaho, 1918.
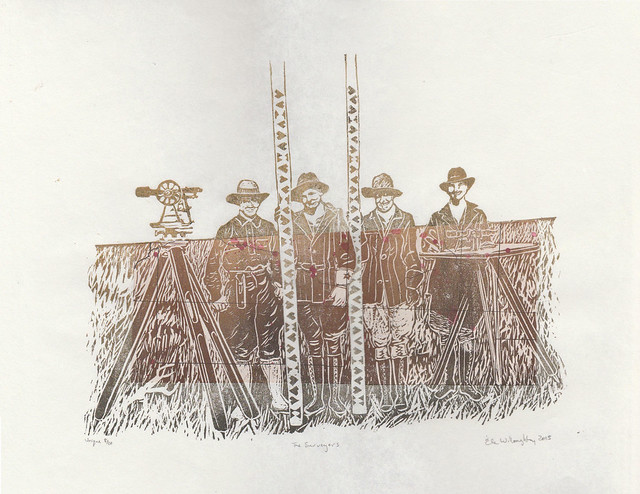
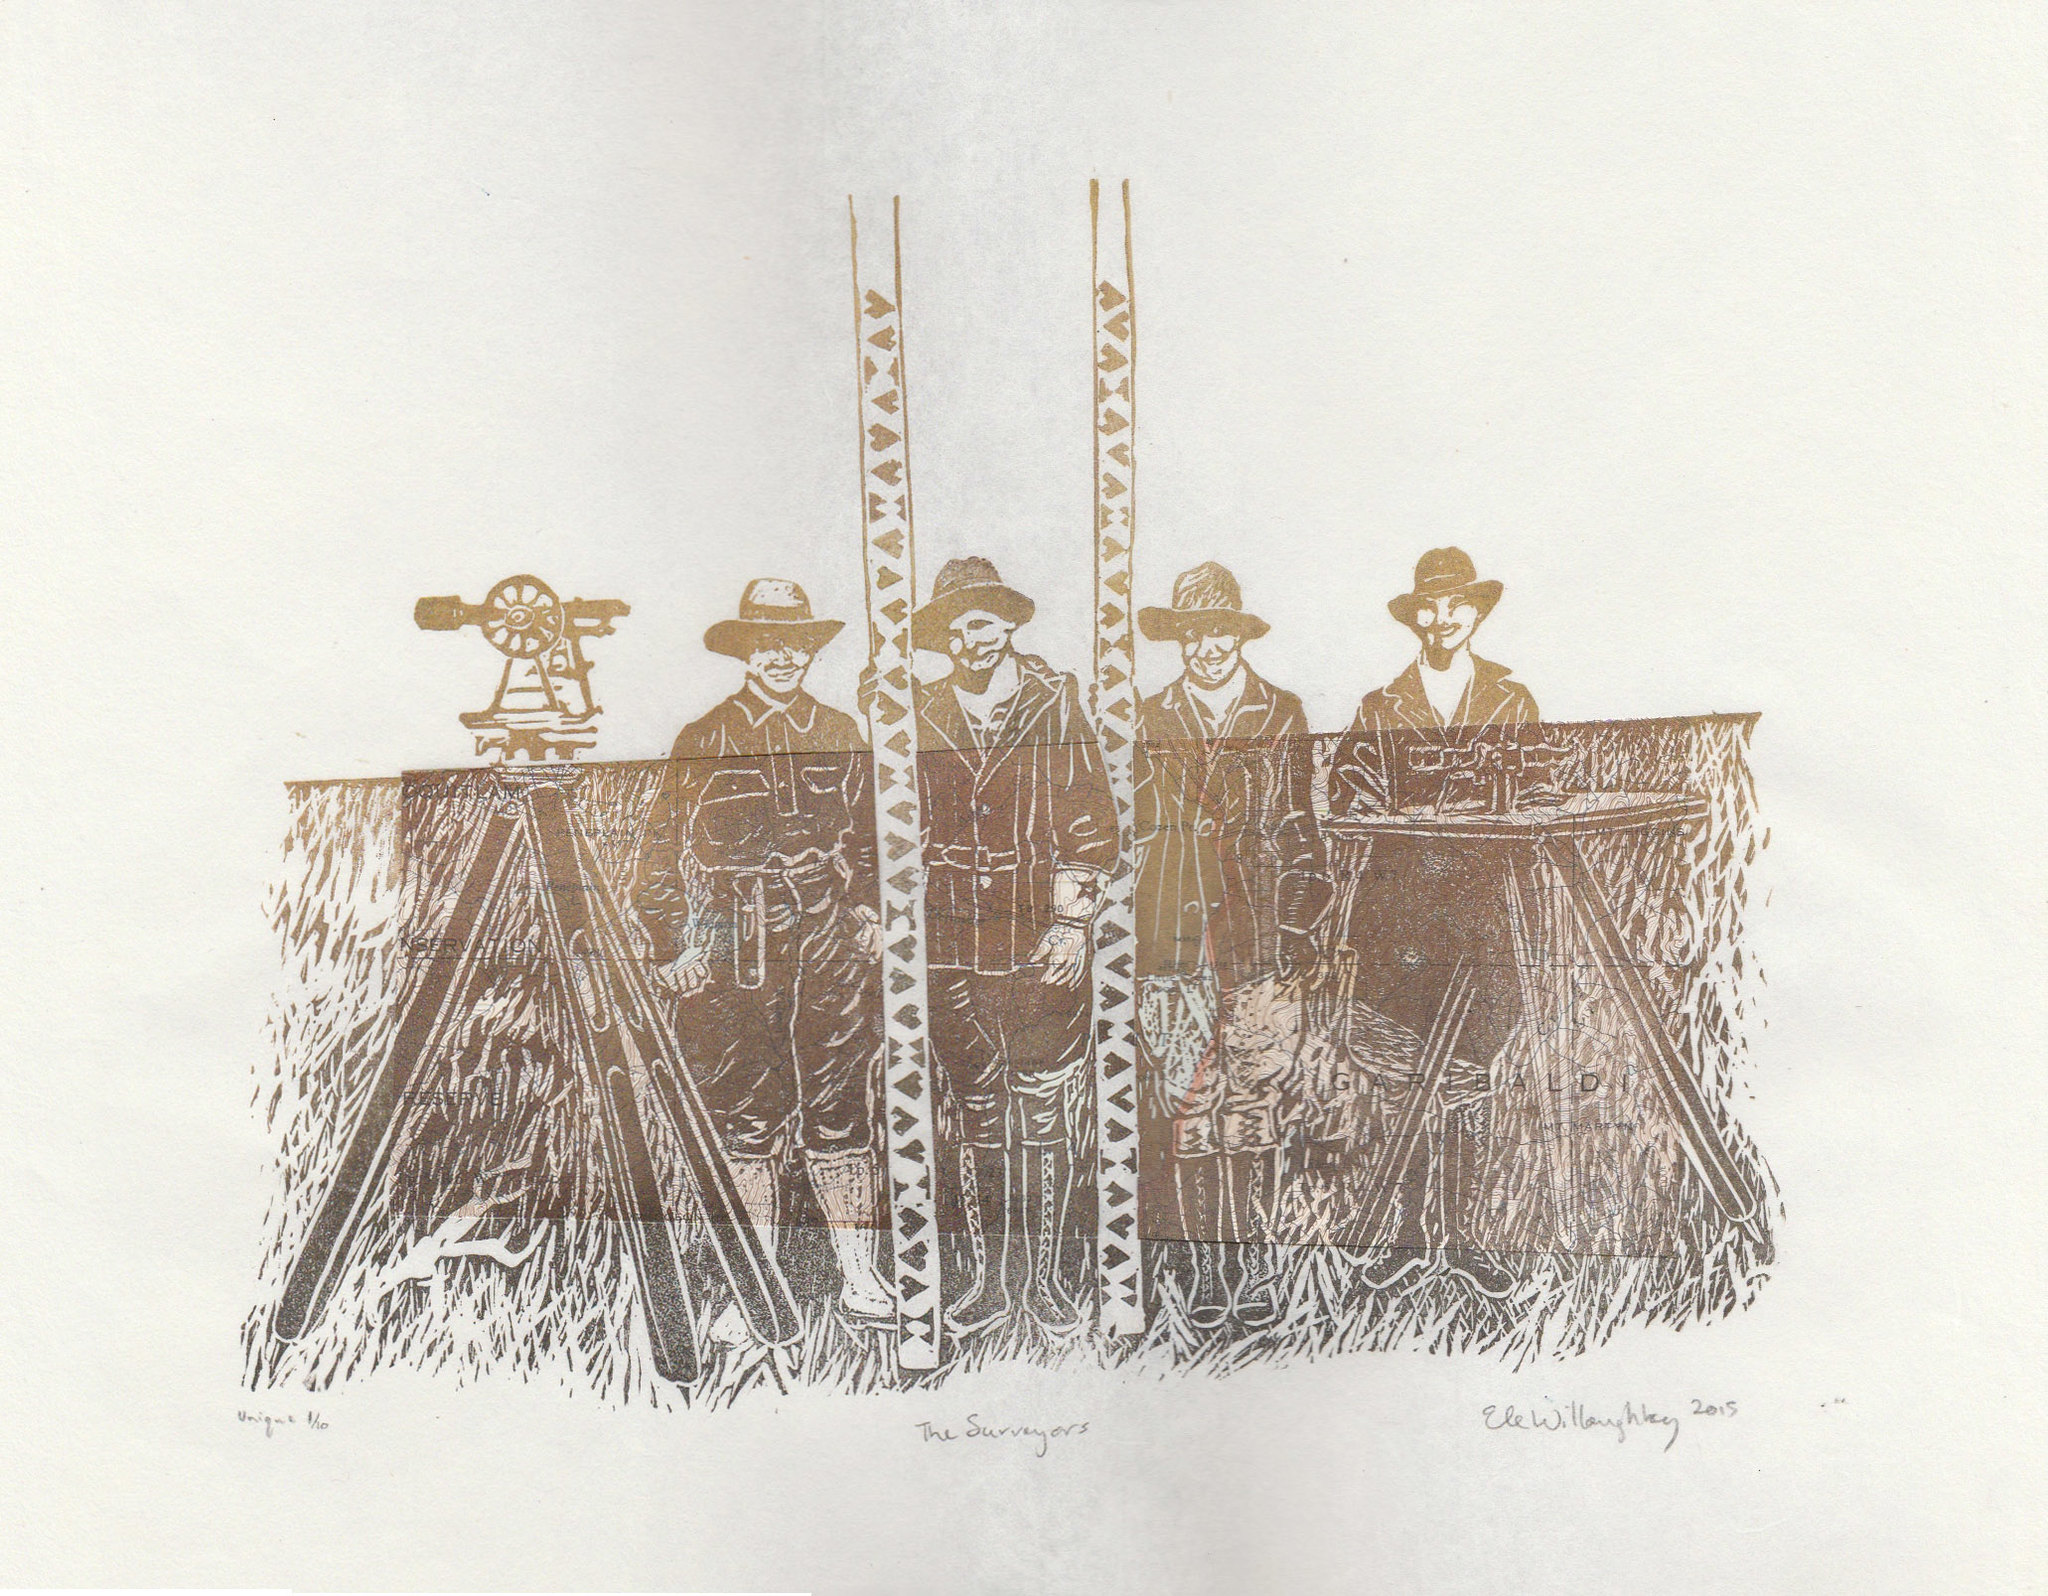
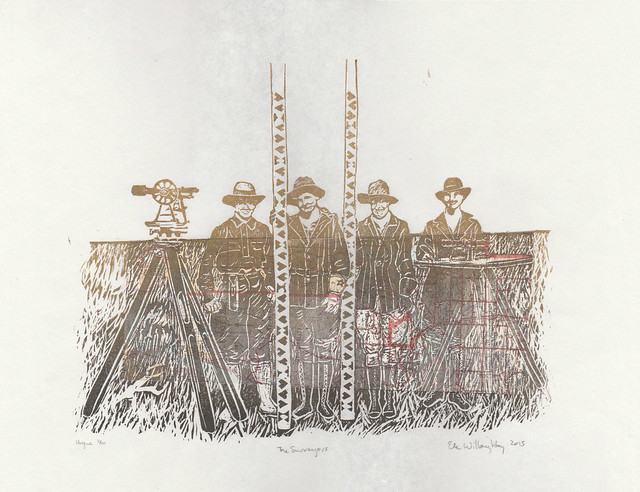
I love when people approach me about doing a fascinating custom order. An artist, Krista Caballero who has been collaborating with many others on a project called Mapping Meaning which brought together "artists, scientists and scholars to explore questions of social, mental, and environmental ecology. Inspired by a photograph from 1918 depicting an all-female survey crew, the project is rooted in a five-day experimental workshop that takes place biennially on the Colorado Plateau." She wanted to thank her collaborators with the gift of a print and wanted to know if I could make an edition inspired by this very 1918 photo. Since one of the things I do is communicate science through art with portraits of scientists (with a special focus on women in the history of science) and I have also done a variety of earth science surveys and mapping, this is very much my thing. In fact, I worry sometimes about hagiography... about only present heroes and heroines, or perpetuating the myth that science is a series the story of a series of lone geniuses. Plus, those survey rods with their odd symbols are so graphic and tempting to one who makes relief prints.

I proposed portraying these women and incorporating vintage geological, topographic and seismicity maps of the western North America, so that each print would be unique. All of the vintage maps came from the Geological Survey of Canada and were actually used in the field - as a tip of the hat to these women. I felt that any marking on the maps actually made them more app. The maps are also from western North America, and are decades old - a little further west and north, and later than these women worked... but they can be tied to similar pioneering surveying work. These hard-working women would have produced the sorts of data fundamental to producing the maps like these geological, topographic and seismicity (or earthquake) maps. The history of science is not only a series of exploits of well-known genius experimentalists, famous for their eureka moments; nor is it simply a tale of paradigm shifts brought about by wiser theorists who suddenly saw the need to shift the entire underpinnings of a given field of science. The history of science is also a tale of hard work by countless unknowns; an all-female survey crew from the early twentieth century seem especially unknown. We have no record of their names and they do not fit our preconceived notions of who explored and mapped the west, or who did fundamental scientific grunt work. I think Idaho in 1918 would still feel like the wild west and imagine these women to be quite fearless.

There are a few extra available here.
Surveyors2
The Surveyors, linocut with vintage topographical map, 14" x 11", edition of 10 each unique, 2015 by Ele Willoughby


Surveyors3
The Surveyors, linocut with vintage topographical map, 14" x 11", edition of 10 each unique, 2015 by Ele Willoughby
Surveyors4
The Surveyors, linocut with vintage geological map, 14" x 11", edition of 10 each unique, 2015 by Ele Willoughby

Surveyors5
The Surveyors, linocut with vintage geological map, 14" x 11", edition of 10 each unique, 2015 by Ele Willoughby

Surveyors6
The Surveyors, linocut with vintage topographical map, 14" x 11", edition of 10 each unique, 2015 by Ele Willoughby

Surveyors7
The Surveyors, linocut with vintage geological map, 14" x 11", edition of 10 each unique, 2015 by Ele Willoughby

Surveyors8
The Surveyors, linocut with vintage seismicity map, 14" x 11", edition of 10 each unique, 2015 by Ele Willoughby

And do check out Mapping Meaning - there's some very interesting stuff there!

Wednesday, March 6, 2013

mapping minouette


via chartsbin.com

I've been looking at some of the great, free data visualization tools that are available on-line. So, to have a dataset to play with, for the mapping visualization, I decided to look at minouette sales (just by total purchases, ignoring whether a buyer bought multiple or single items). Chartsbin let me great the interactive map above, complete with my own colour scheme and my self-selected bins. Maybe you have to be an earth science nerd to think this is cool, but there are all sorts of other options, including the more plotting by equal interval, natural breaks (or Jenks), quantiles, a smooth heat map type (which they call unclassed) or using mapped scaled symbols. You can also control the projection. You can include all sorts of metadata, including mapped images and charts. You can embed them (either interactive or static versions) into your blog or website or even Powerpoint.

Friday, February 11, 2011

urban rhythms

Using the New York City's actual subway system schedule, routes, and expected travel times, recordings of cello pizzicato and a wee bit of artistic licence, Alexander Chen has created Conductor.

Conductor: www.mta.me from Alexander Chen on Vimeo.


He chose certain parameters for aesthetic reasons (colours, fading lines, number of allowed simultaneous trains, and how to relate length to pitch). I love how both visually and audibly the lines appear to be plucked. "When a string is in the middle of being drawn by a subway car, its pitch is continually shifting." The pitch of the sound is determined by length of the straight-line segments but rather to avoid dissonance he stuck with, a "simple major C scale but with the lowest note as a raised third E, which keeps it from ever feeling fully resolved."

{via bioephemera}

Meanwhile, French artist Armelle Caron in her Anagrammes graphiques de plans de villes - 2005 / 2008 series takes cities and deconstructs them into their constituent blocks, arranges these by size and shape and reveals the inner rhythms experienced by the pedestrian - like an anagram of a sentence.*


Berlin


Paris


New York


Istanbul

{via Planetary Folklore}

Friday, February 4, 2011

Charting a Course

Mercator Earlier this week, Ulixis, my colleague on the Mad Scientists of Etsy Street Team, featured my Mercator block print on her blog, and then cross-posted it to the Mad Scientists of Etsy blog (which, you know, you should follow, cause it's awesome). Then this morning, 'Etsy Finds' the daily shopping guide which one can receive via email from Etsy (or view here) featured my Mercator in a sailing and exploring themed (how apt is that?) missive, under the section "Charting a Course"! The print sold before I was even able to open my email, as some buyers are clearly swifter than I.


So, I am going to say that so far I like the Year of the Rabbit, what with one art show and five prints and one pillow sold already. In my experience, if you are an etsy seller and wonder about whether you might want to join a team, I would say yes! Also, I'm thinking that my on-going shop makeover project is going well.

Did I mention I love my new scanner?

Everything you wanted to know about Mercator, but were afraid to ask...
Gerardus Mercator was a 16th century Flemish cartographer. I would say "The" cartographer, except Flanders seemed to be overrun with first rate cartographers in the 16th century (Gemma Frisius, Abraham Ortelius... stiff competition), perhaps because mapping their territory was extremely challenging, what with the floods and the succeeding armies... I don't even know how they managed to keep track of whether they were (bizarrely) part of Spain, or the Holy Roman Empire or what. Mercator himself had to be on the ball as his tendencies ran to the Protestant end of the spectrum.

What made Mercator a contender for "The" cartographer, was in fact his abilities as a mathematician -and like those of us scientists who feel compelled also to create art he was wasn't hindered by his immense ability as an engraver. He produced beautiful world maps (a version of which is depicted in this print), globes, but his name has gone down in history for the Mercator Projection. The Mercator projection is a cylindrical map projection which became the standard map projection for nautical purposes because of its ability to represent lines of constant course, known as rhumb lines or loxodromes, as straight segments. While the linear scale is constant in all directions around any point, thus preserving the angles and the shapes of small objects (which makes the projection conformal), the Mercator projection distorts the size and shape of large objects, as the scale increases from the Equator to the poles, where it becomes infinite.

The Mercator projection will be quite familiar to you. It is generally used as a sort of 'default' projection, even today. If you are Canadian, like me, you might be lead to over-estimate the size of the arctic archipelago and underestimate the immensity of the African continent, due to the ubiquity of this projection. However, his achievement was fundamental to the explosion in exploration that came after his paradigm breaking world maps.

When the Mad Scientists of Etsy chose CARTOGRAPHY as our theme for November, 2008, I knew, as an earth scientist, (especially a marine geophysicist, used to spending quality time with nautical charts), a lover of the history of science and as a printmaker, that Mercator was the apt choice.

This is a two-colour (two block) lino block print. It is one of a first edition of only 6 prints. I carved two blocks in reverse; one representing his world map of 1595 in green and the second based on contemporary portraits in black, printed on Japanese washi paper 10" by 10.8" (25.5 cm by 27.5 cm). The edition is variable and each print is unique in its own way.

Tuesday, December 1, 2009

Nicolas the Giraffe

giraffe 021 Nicolas the giraffe is an antiquarian bookseller who dreams of finding ship-wrecked treasures. He collects antique nautical charts. He uses his expertise in papers, marbling and book-binding as an excuse to gain access to journals of the great explorers. He's interested in joining you on your next adventure.

You have no idea how many maps I have. Heck, I have no idea how many maps I have. The Geological Survey was just throwing them away! I get envelops occasionally from scientists which are re-purposed old geological maps... and I hoard them!

On a separate note, since no one ever blogs to compliment the weather, I will. We just experienced the first snow-free November in Toronto since they started keeping records! It was lovely and fall like. We are very lucky. The crazies have been out in shorts for most of the month. This morning, when I got up, there was dusting of snow on the roof next door. Overnight, the leaves which were still on the trees seem to have fallen.


giraffe 050
giraffe 044

Tuesday, April 21, 2009

projections

mercator 1If you are interested in math or maps or read this blog, you know that you cannot take the 2D surface of a sphere and conformally map it onto a plane (such that both the shape and size of the surface are depicted properly everywhere). So there are a whole lot of different projections out there. Our friend Mercator has won the popularity contest- and after all, his project is useful for most mid-latitudes, though gets a little silly near the poles (and hence, as a Canadian, is something of which I cannot help but be reminded every time I see our North so distorted).


Buckminster Fuller mapped the earth unto a 20-sided polyhedron called an isocahedron, and then unfolded it with theDymaxion map.


The myriahedral projection (by Jarke J. van Wijk) breaks the earth up into nearly-perfectly-mappable bits and "unfolds" them, having decided that it is better to be disjointed than wrong. This takes matter to the logical, if irregular and unexpected, extreme!


[via the map room]

Wednesday, April 8, 2009

Imaginary Subway Maps

I guess it's maps this week. I have a thing for maps and map art. I love subway maps. I love maps of imaginary places. Here is a twist: a set of subway maps of real places wherein there are are no subways.

[by Transit Authority Figures via Apartment Therapy]
Oh! This would make getting to the Woods Hole Oceanographic Institute so much easier.

They have a few other maps for smallish places in New England. I don't know the area well enough to understand all the jokes (though I am pretty sure that say 'Landfill' and neighbouring 'Polo Grounds' and well as 'Malfunction Junction' stations in Machester, Vermont are jokes, and 'Kandahar' is well, saying something; likewise 'The Bath Tub' on the Cape). Though, having drive to and around Wood's Hole, I do know that some of the least probable names are in fact legitimate.

Monday, January 26, 2009

Maps, typography, slogans and unfortunate place names...

Via stange maps we have maps which combine two of my favorite things: typography and, well, maps-

[This map is taken from this page at vladstudio, a website for Siberian graphic designer Vlad Gerasimov’s work]

and this one, which admittedly has been all over the blogosphere, but it is so intriguing and pretty - it is a map of use states as their mottos:


[The map, The Fifty United States and their Mottos, 30x40 inches, 2008 can be found on the Two Eyeballs website, where the artist Emily Wick showcases her work. She's also done individual states.]
I am not familiar with the history here, but some of these are quite unexpected (i.e. Oregon "She flies with her own wings"; Kansas "To the Stars through Difficulties"; Washington "By and By" - what sort of motto is that?; and Michigan is so literal that it made me laugh). These are linoleum block prints!

This is a map I found via biophemera. It was published by the NY Times, it shows (allegedly, formerly innocuous) embarrassing place names in Britain, now the subject of two books, "Mr. Bailey, who grew up on Tumbledown Dick Road in Oxfordshire, and Mr. Hurst got the idea for the books when they read about a couple who bought a house on Butt Hole Road, in South Yorkshire."