


 |
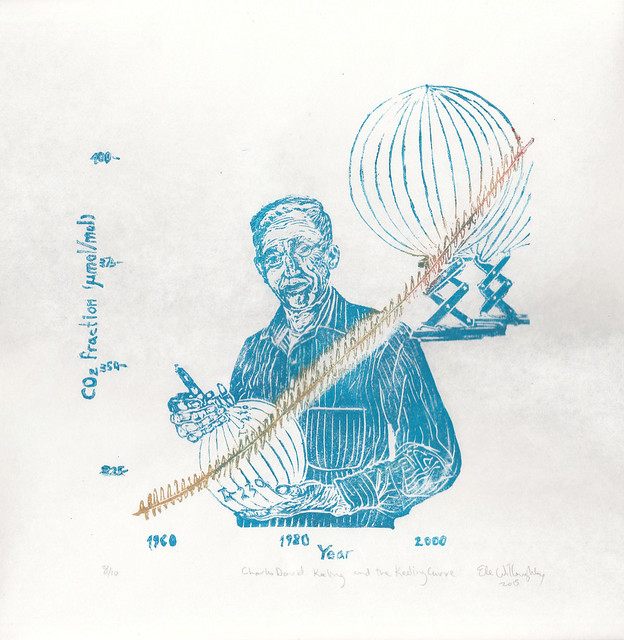
| Charles David Keeling and the Keeling Curve, linocut 12" x12", 2015 by Ele Willoughby |
Sometimes, I take suggestions for prints subjects, especially the scientists series. This is a portrait of American geochemist Charles David Keeling (1928 - 2005) whose decades long observations of carbon dioxide (CO2) in air samples at the Mauna Loa Observatory were some of the first direct data to show the human contribution to the greenhouse effect and global warming. He was suggested for an upcoming Art.Science.Gallery show about climate change. The 'Keeling Curve' shown in copper and red shows both the seasonal variations (the wiggles) and the strong upward trend with time as CO2, a known greenhouse gas (which traps solar radiation), built up in the atmosphere. It turns out this is topical, not only because climate change is always topical, but this week, the American Chemical Society honoured the Keeling Curve as a National Historic Chemical Landmark at a ceremony at Scripps.
After completing his PhD in chemistry at Northwestern in 1954, he did a postdoc in geochemistry at the California Institute of Technology where he developed the first instrument to measure carbon dioxide in atmospheric samples. He then joined the Scripps Institute of Oceanography at UCSD, where he remained for his career, as a professor of oceanography. He had good timing; 1957 - 1958 marked the International Geophysical Year and he was able to get IGY funding to set up a base 3000 m above sea level at the Mauna Loa Observatory in Hawai'i, where he put his CO2 measuring methods to work. He also gathered similar data series at Big Sur, California and in Antarctica. Prior to his studies, scientists believed that CO2 levels were simply variable, without the sort of clear patterns he observed. Between 1958 to 1960, we was able to show the daily pattern of change due to respiration from local plants and soils as well as the seasonal variations in CO2 levels; by 1961 it was clear there was also a strong upward trend in the 'Keeling Curve' which roughly matched the amounts of CO2 released by our own burning of fossil fuels.
The National Science Foundation cut off his funding, arguing that the results were "routine" though they nonetheless used his data to warn of the risk of global warming. He was forced to abandon his studies in Antarctica, but managed to keep the Mauna Loa experiment going. These measurements at Mauna Loa continue to this day and are the longest continuous record of atmospheric CO2. They show a rise of 315 parts per million by volume (ppmv) in 1958 to 401 ppmv as of April 2014 and this increase has been accelerating in recent years with serious implications for climate change.
Due to the seriousness of these data, the National Oceanic and Atmospheric Administration (NOAA) lanunched their own worldwide CO2 monitoring program in the 1970s, including at Mauna Loa, alongside the Scripps experiment. After CD Keeling's death in 2005, the Scripps measuring experiment was taken over by his son, Ralph Keeling, professor of geochemistry.
Keeling received many accolades during his lifetime. In 1986, he was elected a fellow of the American Academy of Arts and Sciences and a member of the National Academy of Sciences in 1994. In 2002 Keeling was awarded the National Medal of Science, the highest award for lifetime achievements in science granted by the US. He received the Tyler Prize for Environmental Achievement for his data collection and interpretation in 2005.
No comments:
Post a Comment