Showing posts with label Niels Bohr. Show all posts

Friday, February 9, 2018

Niels Bohr, the Bohr-Rutherford atom and Balmer series, take 2

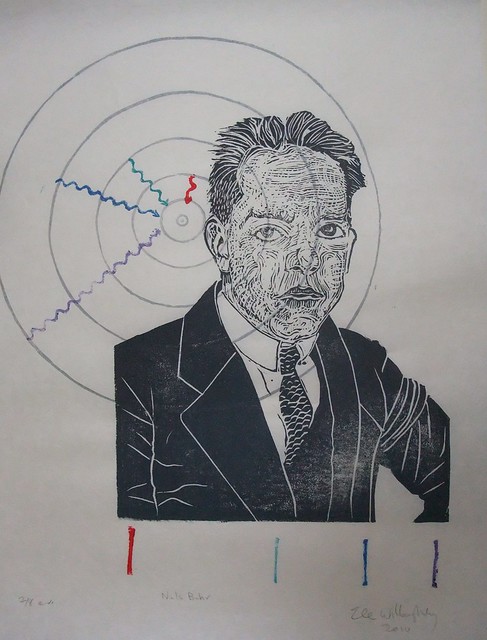
Niels Bohr, 2nd edition, 11" x 17" linocut print, 2018 by Ele Willoughby

I've just printed a new edition of my portrait of quantum physicist Niels Bohr (1885-1962). One of his most famous contributions to quantum mechanics was the Bohr-Rutherford model of the atom. Bohr is shown next to the Bohr model of the Hydrogen atom (all the concentric circles are actually at the appropriate spacing, proportional to the n squared, which probably reflects on my sanity in some way). Bohr proposed that the orbits of electrons were somewhat like planetary orbits (though circular, and at specific quantized distances). To explain how orbitting charged electrons didn't lose energy and annihilate spectacularly with the so-called "spiral death" (physicists are big on melodrama, I'm telling you), he stipulated that perhaps they simply weren't allowed anywhere but the specific orbits. They could lower their energy state if excited by falling to a lower orbit, giving off a specific photon of a specific colour related to the difference between energy levels. This also explained how the spectra of gases had distinct, thin, spectral lines. I've illustrated this with the Balmer series - because it is composed of lines which are visible to the eye (H-alpha is red and caused by a jump from the 3rd to 2nd orbit; H-beta is cyan and caused by a jump from the 4th to 2nd orbit; H-gamma is indigo and caused by a jump from the 5th to 2nd orbit; and H-delta is violet and caused by a jump from the 6th to 2nd orbit). I've shown both the quantum jumps (squiggly arrows - squiggly lines are tradition for photons) and by the line spectrum below Bohr.


Confession: In the first edition, the model of the atom was behind him. It turns out that if your four year old beloved son/tyrant wakes you in the middle of the night and keeps you up for some time, you probably aren't with it enought to try and print a 6 colour linocut with a tricky registration. I didn't change this print based on an aesthetic decision. I simply messed up the layout but decided to run with it. I decided I like it this way.

Sunday, October 26, 2014

Data as art: X Marks the Spot

Niels Bohr portrait 4
Hayley Gillespie at Art.Science.Gallery in Austin noticed that some of my prints submitted for previous shows would also fit for their latest: X Marks the Spot. She describes the show thus:

Quantitative or categorical, discrete or continuous, dependent or independent, variables allow scientists to measure and describe properties of the world around us. They are common to every scientific discipline and assume a wide range of possible values. With gravity and humor, precision and abstraction, record-keeping and experimentation, variables are made visible through the works of eight contemporary artists.


So, from October 25 to November 23, 2014, you can find my portraits of Niels Bohr, Caroline Herschel and Florence Nightingale, on exhibit. The show features eight artists, many of whom are 'data artists' and the images online look fascinating.

Caroline HerschelIt's particularly interesting to me, since I haven't really thought of my work as illustrating data or variables, per se, so much as illustrating the scientists themselves, since their work is integral to a full portrait. I believe mine are the only portraits and other works are more abstract, less figurative.

Each of these portraits does actually, now that I think about it, contain some precise representations of variable data. Niels Bohr's portrait contains the Balmer series of spectral lines given off by excited hydrogen gas. Caroline Herschel's portrait contains her own diagrams of the night sky and her observation of one of the several comets she discovered (hence, a mapping of position over time). Florence Nightingale's portrait shows her own statistical investigation of the causes of mortality amongst British troops during the Crimean War, shown plotted as a polar area diagram – her own statistical and data visualization innovation, sometimes called a Nightingale Rose Diagram.

Florence Nightingale portraitThe other artists involved in the show have taken data -both their own personal life data, they have gathered themselves and freely available datasets and created artworks where they have developped their own methodologies for representing the data. They are working with everything from an artist's own personal experience of cancer care, the weather (where storms themselves are involved in the mark making), using algorithms to turn winds into drawing, to the instances where H.G. Wells specifies colour in his novels!

One of the artists involved had been turning her own data into art - things like walks she takes, daily activities and nightly EEG sleep data - and then recognized that she is doing something algorithmically which could be translated into a phone app which would allow anyone to make art from their own daily lives. If you're in Austin, check out the artist's talk by Laurie Frick on November 8. She'll explain her process and her smartphone app FRICKBits, and how you can use it to make art of your daily life too. How cool is that?! The app is for iPhone, and I have an Android, so I might have to ask RJH if I can play with his phone.


In other news, if you happen to be in Europe and read German, check out the Christmas/New Year issue of Happinez magazine, which will be featuring my Chinese Zodiac series!